
A few weeks ago, about 60 people, including farmers, ranchers, and backyard gardeners like myself, were gathered for a two-day workshop on soil health hosted by the Center for Regenerative Agriculture at CSU, Chico.
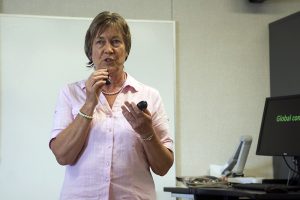
Christine Jones, known as the “Pearl” of soil microbiology, was half way through her fascinating presentation on soil research and practices she was involved with in Australia when she seemed to suddenly change course. She appeared to break away from her prepared presentation to drop what felt to some of us like a bombshell.
Jones made the argument that carbon dioxide actually has very little direct impact on global warming in comparison to air moisture. We need to focus on restoring the broken water cycle, she said.
Suddenly, Jones was preaching water vapor to a group acclimated to a climate-change language and perspective anchored on the parts per million (PPM) of CO2 in the atmosphere. To some of us in the room, the unfamiliar insight — the negative impact of atmospheric water — felt like she had committed heresy.
CO2’s effect on climate has been theoretically recognized for over a hundred years, and for the past 60 years, the markers of PPM CO2 have been, and continue to be, the touchstone, the anchor of the language we have learned in order to identify, measure, and approach the subject of climate change mitigation. It is the touchstone popularized by organizations like 350.org, and it dominates discussions of climate change in popular media.
In contrast, measuring air water vapor is much harder than tracking CO2 levels because air water vapor circulates and varies so much from place to place and elevation to elevation. Climate scientists knew that theoretically it made sense, but they had no way to measure accurately the wide variety of moisture levels through 10 miles of Earth’s atmosphere.
That changed in 2005. Scientists by then had the technology and opportunity to measure precisely the moisture content throughout the lowest 10 miles of the atmosphere and confirm and quantify the influence of atmospheric moisture on temperature rise. This technology has dramatically improved our ability to both track and predict the weather.
The recent heat wave across the central and eastern United States was accurately predicted and forecast days in advance. This weather pattern was considered dangerous, not so much because of high temperatures as by high humidity with dew points in the 70s and even 80s. The increased predictability of weather and the increasing impact of soil moisture on creating severe weather events, both cold and hot, have been integrated almost subconsciously into daily, and vastly improved, weather forecasts.
The trick for land use managers at all scales is to make that awareness conscious and part of our language.
The broken water cycle is a recurring theme to all of us involved in agriculture. We are aware that current agricultural practices have significantly broken the ability of our soils to absorb water. Author Roland Bunch’s presentation at CSU, Chico, a couple of years ago was about how Africa’s so-called “drought” was not due to lack of moisture, but degradation of the soil health. With that degradation, the soil had a vastly reduced capacity to absorb and filter water falling from the sky. In other words, a broken water cycle had occurred. We were familiar with the effect that tillage and cropping systems had on the water cycle in the ground, but in the atmosphere? Not so much.
Consideration of air moisture as a primary driver of global warming presents an epiphany that is hard to swallow, in part because the relationships are complicated. CO2 is directly responsible for about 20% of global warming. Water vapor is directly responsible for about 50%.
The simplified explanation is that CO2 acts as the volume control and water vapor acts as the amplifier. As temperatures rise because of CO2 emissions, the atmosphere has the ability to absorb more moisture. How humans manage water use can either enhance or buffer the effect.
We land use managers should acknowledge that Jones dropped not a bomb, but a pearl. It did not fall from the necklace she wore that has given her the moniker “pearl,” but from the new and unfamiliar topic she introduced.
Our agricultural/environmental relationship to CO2 is straightforward. We need to get carbon out of the atmosphere and into the soil.
Our ag/environmental relationship to H2O, simply stated, is: “It’s very complicated!” – which means we are steering this land craft partially blind, by intuition and by the seat of our pants. But the primary objective is much the same as for carbon: We need to get water vapor out of the atmosphere and below the soil surface, either into the soil or into underground aquifers.
The question then is, what are best land-use practices? Are we better off with dryland farming or irrigated agriculture? If we’re irrigating, from what source? And how much? How should irrigated water be applied, and when should it be applied (season, time of day, weather conditions.) These are the details we must wrestle from the devil.
The challenges of regenerative land use management, like all science-based real-life applications, demand that we translate and communicate what information we have into practical discussions and applications, even as new information comes streaming toward us at faster and faster rates.
The next workshop offered by the Center for Regenerative Agriculture is Dec. 3 through noon Dec. 5. Scholarships are available.
Richard Roth has farmed, gardened and contributed to ChicoSol for many years.
Carbon 415.78ppm + Methane Natural Gas 2,300ppb + Water Vapour = Global Warming Extreme Deadly Weather
Add 1.8C. Temp Rise Carbon
Add 1.8C. Temp Rise Water Vapour
Add 1.8C. Methane Natural Gas 2,300ppb Temp Rise Methane natural Gas
= 5.4C. Temp Rise Now
Global Warming Extreme Deadly Weather
Climate Changing Sea Level Rising Over 220 Feet
Today Tonight Tomorrow with in 36 months ?
“The vast expanse of sea ice around Antarctica has suffered a “precipitous” fall since 2014, satellite data shows, and fell at a faster rate than seen in the Arctic.
The plunge in the average annual extent means Antarctica lost as much sea ice in four years as the Arctic lost in 34 years.
The cause of the sharp Antarctic losses is as yet unknown and only time will tell whether the ice recovers or continues to decline.” Damion Carrington
Warmer Oceans, Hotter Temperatures From Burning Fossil Fuels, In 2005 Methane Feed Back Loops Starting Accelerating The Heat In Oceans and Atmosphere
US Federal Reserve Energy Policies are Poisoning an Killing us Destroying Our Fragile Life Sustaining Eco-Systems
Methane Natural Gas US Federal Reserve Freedom Molecule Is The Molecule of Extinction
Temperatures leap 40C. degrees above normal as the Arctic Ocean and Greenland ice sheet see record June melting June 14 at 12:52 PM
20 Feet of Sea Level Rise in Greenland
200 Feet of Sea Level Rise in Antarctica
Last Time Parts Per Million Of Carbon Was Over 410ppm
Sea Level Was Over 130 Feet Higher Than Right Now
Carbon Is At 415.78ppm an Rising
Carbon 415.78ppm + Methane Natural Gas 2,300ppb + Water Vapour = Global Warming Extreme Deadly Weather
Add 1.8C. Temp Rise Carbon
Add 1.8C. Temp Rise Water Vapour
Add 1.8C. Methane Natural Gas 2,300ppb Temp Rise Methane natural Gas = 5.4C. Temp Rise Now
Feed Back Loops Kicking In, In 2005 Are Not Calculated In the Total Temp Rise,
Four Geological Formations Spewing and Venting Methane Now In The Arctic and one Venting Along The Washington Oregon Coast
Perma Frost Melting
Methane Hydrates
Mantle Methane From Isostatic Rebounding of Greenlands North American Plate
“Pingoes
Pingoes— Started in 2005 Finger Size Blow Holes, Now 300 Foot Wide Methane Blow Holes Increasing in Number and Size, in Siberia, Canada, an the Euro-Asian Plate Pingoes and Under Water Pingoes
“Pingos preceded blow-outs Researchers have now examined satellite images of northern Siberian from a few years back and looked at the area where the explosions occurred.
They found that the year before the huge crater appeared, there were large pingos in the same place.
Pingos are found in the arctic and are usually raised hills, like a giant pimple, with a core of ice.
In this case, however, the pingos must have been filled with gas in the form of ice, bound up with water in gas hydrates and permafrost.
Russian scientists have now mapped 7,000 gas-filled pingos that are poking through the thawing permafrost, visible in satellite images that illustrate how the pingos form and grow, published in The Siberian Times.” Siw Ellen Jakobsen
We Are Already Locked in to 20C. Temp Rise Even If We Stopped Emitting Now
Methane has a 10 year lag time an Carbon has 30–50 Year Lag time in Reaching its Full Molecule Potential in Holding Heat Mass
Methane has 130 Times More Heat Mass in the Molecule in First Ten years
Then 86 Times More Heat Mass per Molecule over 20 years
Then 34 Times More Heat Mass per Molecule over next 80 Years Than Carbon
Methane Burp Or Pingoe Popping Pimple
and at some point, like Natalia Shakhov, Guy Mcpherson, and Kevin Hester point out, we are going to experience a Methane blow out in the Arctic, from Mantle Methane, Perma-Frost, Methane Hydrates, Pingoes.
The Methane has been telling us, it is going to blow since 2005 by Maria Shakhov, what was a finger size blow whole in 2005 is now a 200–300 ft. wide blow hole called Pingoes 2015
And their increasing in number and size in Siberia, North American Plate, and on the Euro-Asian Plate
We Are At 6C. Temp Rise According To Record Deadly Weather
When Will Greenland and Antarctica Collapse ?
Great Lakes Lake Levels Rising Because of Record Rain an Greenland Melting
All That Ice an Snow Is Heavy Water Coming Off Of Greenland and Antarctica Sinking The Ocean Floors Putting Pressure on the Thermal Convection Belt Between The Crust an Mantel
This Stress is Relieved By Lava Magma Eruptions and Plate Tectonic Movements
Earth Quakes and Volcanos
There is Still Over 218 Feet of Sea Level Rise to Sink the Ocean Floors
When Will Greenland and Antarctica Collapse ?
Will They Collapse This Summer ?
The Past Three Winters it Has Been Raining In Greenland
Will Greenland Collapse in a Winter Rain Bomb ?
When Will Greenland and Antarctica Collapse ?
Today Tonight Tomorrow With In 36 Months ?
Kuwait June 12 2019 147F.
Area in China 6 Feet of Record Rain
Jalisco Mexico 5 Feet of Snow
Japan 4 Inches of Rain in 1 Hour, 17 inches of Rain Total in the Passing Storm
Europe 120F. Heat Wave
Midwest ununited states Flooded
Our New Normal Since 2000 Record Rain has been 29 percent — 600 Percent Increase in Rain
Record Rain, Record Snow,
Record Highs Record Lows
Record Winds, Record Waves
Record Fires, Record Floods,
Record Volcanic Eruptions
Record Hurricanes, Record Tsunamis,
Record Typhoons, Record Earthquakes,
Record Mud-Slides, an Record Sea
Surges. Record High Tides, Record Sea Level Rise
Carbon + Methane Natural Gas + Water Vapour + Methane Feed Back Loops Kicking in, in 2005 = Global Warming Extreme Deadly Weather More Like 5.4C. or 6C. ?
Temp Rise Now
Not IPPC 1.8C. Temp Rise
444 Nuclear Reactors
450 Nuclear Fuel Rod Facilities an Their over 1,300 Fuel Rod Pools
Over 250,000 Toxic Tons of Radiated Nuclear Waste
Over 14,000 Nuclear Weapons
There Is So Much Uranium In The Oceans They Will Be Mining It Soon or Not
Greenland and Antarctica Melting Calving Getting Ready To Collapse When ?
Today Tonight Tomorrow With In 36 Months ?
We Should Not Throw In The Towel, Now Is The Time To Act
Campaign to Allow Californian Residents to Sell Electricity Obtained by Renewable Energy To the Utility aka Feed In Tariff
We Need a National Feed in Tariff
Will you read, sign, and share this petition?
https://petitions.moveon.org/sign/let-california-home-owners
Daniel Ferra, thanks for you comments and interests. The reason I have focused attention on the Regenerative Agriculture Program at Chico State is that it is local, and to me Regenerative Ag holds the greatest potential for solving the problems and the solutions and tools can scale from micro to macro scales. Anyone interested in doing something about climate change has the opportunity and access to the resources of the Regenerative Agriculture Program at Chico State.